How To Turn 10oz of Gold Into 65oz: The Power of Ratio Trading
Gold & Silver | Paid Subscriber Post
Hey everybody,
In today’s newsletter I discussed playing the gold to silver ratio. I did have an article on this already but I decided to update it for you all and republish it with some additional notes. So in this article, I’ll walk you through one of my favorite investing strategies: trading the ratios. Which, if used correctly, will help you to significantly grow your wealth over time—with minimal effort and in many instances, only a modest initial investment. In fact, you could make a single investment, never add another penny, and still come out far ahead.
Sounds too good to be true? Let me show you how.
Why Ratios Work
Before we dive into trading the ratios, let’s first revisit some key fundamentals. Long-term investing success is based on a simple principle: buy assets when they’re undervalued and sell them when they’re overvalued. This is the essence of the classic “buy low, sell high” strategy, and it’s the foundation for growing wealth over time. It’s also the lowest-risk form of investing.
But how do we determine if an asset is truly undervalued or overvalued? Simply looking at its price in FIAT currency isn’t enough, because it's constantly being debased over time. To measure value more reliably, we need a better standard. One of the most effective ways to do this is by valuing assets in gold ounces—real money that holds its value over the long term and accounts for the erosion of FIAT currencies.
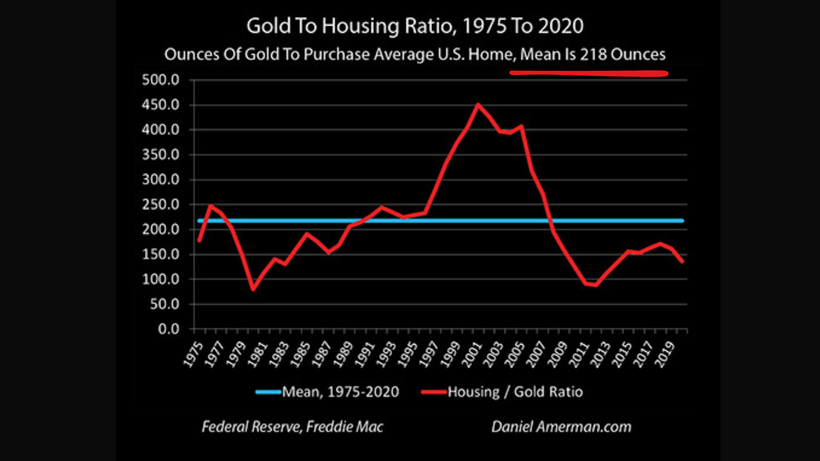
For example, if we wanted to assess whether the property market is currently expensive or not, historically speaking, we could look at the average price price of a house in ounces of gold. This gives us the gold-to-real-estate ratio. By comparing this ratio to other periods in history, we can quickly determine whether property right now is underpriced, overpriced, or fairly valued. This approach provides much more insight than simply looking at a property’s price in FIAT, which actually tells us very little.
The same applies when selling a property. Many people assume they’ve made strong returns on real estate over the past two decades—only to realize, once they run the numbers in gold, that they’ve actually lost value in real terms. By which I mean inflation adjusted, using gold as the barometer, they get far less for their property today than what they paid for it, even if nominally speaking the numbers have a gone up substantially.
You can try this one out for yourself. You simply calculate how many ounces of gold it took to buy your property originally, by going back and looking at the gold price at the time you purchased your house, then convert the price you paid to oz's of gold. Now figure out how many ounces of gold you could buy back, if you sold the property at today's fair market value. The result can be sobering. For a lot of people, it’s not the windfall they imagined—it’s a quiet loss masked by inflation.
Going back to our trading the ratios strategy, once you’ve identified the historical range of a particular ratio, you have a powerful tool. In the above example, when the gold-to-real estate ratio is above 250oz—it would signal that housing is becoming overpriced relative to gold. At the upper end of the range as you move towards 350-450oz, property has become extremely overvalued. Conversely, if the ratio drops down beneath 200, it tells us that housing is becoming undervalued compared to gold.
In this way, ratios open the door to a strategy; which in this instance would be moving into gold when housing is expensive relative to it, and rotating back into real estate when housing becomes cheap in gold terms. A powerful example of this from my coaching for investors, is housing vs gold in Great Britain between 1970 and 1980.
What makes this approach so powerful is its ease of use and versatility—in that it can be applied to a wide range of assets to help us identify when things are becoming expensive or cheap. Although gold is ideal for measuring assets against, we don’t have to limit ourselves to only using gold as our benchmark. We can also use ratios to compare two different assets to determine which one is undervalued or overvalued, relative to the other.
For example, we could compare the price of a barrel of oil to the price of an acre of farmland in a specific region, or the price of a ton of copper to the price of a ton of steel. This strategy works regardless of the overall financial conditions, because prices between assets are always fluctuating relative to each other. If we pay attention to these shifts, we can capitalize on them.
The key is not to fixate on the FIAT price of an individual asset, but to instead focus on the relative value of the asset to other investable assets or asset classes. By monitoring and acting on these disparities over longer periods of time, we can make more informed decisions and take advantage of market inefficiencies.


